How often have you found yourself creating the same issues over and over again? With Issue Templates, you can create reusable templates for your issues and save time on repetitive work.
The app is absolutely helpful for us. It makes creating projects with certain authorizations, fields, screens and boards so much easier. Repetitive issues can be created with ease. I also have to compliment the support, which is quick and uncomplicated.

Nov 28, 2024
Once you get this product configured the way you want this to work for you, it is a simple few clicks and the plan. templates, and boards, are set up the way in which they will work for you or your purpose. The support is incredible from the staff.

Oct 25, 2024
Has been very useful for us in quickly creating issues, while ensuring compliance with formatting and content standards.

Jun 12, 2024
I recently had the opportunity to use the trial version of your templating app for managing my redundant software tasks and subtasks generated after each Epic. From my initial experience and online research, I found your app to be extremely useful and time-saving for both developers and project managers.

Jun 12, 2024
The tool has been essential in keeping all important information within our development workflow, with multiple teams able to work on suggesting and improving our product. The learning curve has been very smooth for all company teams

May 22, 2024
This app really saves us a lot of time. We use it several times a week and have probably already created more than 250 tickets using the templates. One positive thing to emphasise is that new functions are constantly being added. It is user-friendly and very easy to use.

May 20, 2024
The app is absolutely helpful for us. It makes creating projects with certain authorizations, fields, screens and boards so much easier. Repetitive issues can be created with ease. I also have to compliment the support, which is quick and uncomplicated.
Nov 28, 2024
Once you get this product configured the way you want this to work for you, it is a simple few clicks and the plan. templates, and boards, are set up the way in which they will work for you or your purpose. The support is incredible from the staff.
Oct 25, 2024
Has been very useful for us in quickly creating issues, while ensuring compliance with formatting and content standards.
Jun 12, 2024
I recently had the opportunity to use the trial version of your templating app for managing my redundant software tasks and subtasks generated after each Epic. From my initial experience and online research, I found your app to be extremely useful and time-saving for both developers and project managers.
Jun 12, 2024
The tool has been essential in keeping all important information within our development workflow, with multiple teams able to work on suggesting and improving our product. The learning curve has been very smooth for all company teams
May 22, 2024
This app really saves us a lot of time. We use it several times a week and have probably already created more than 250 tickets using the templates. One positive thing to emphasise is that new functions are constantly being added. It is user-friendly and very easy to use.
May 20, 2024
All of the reviews can be found on the Atlassian Marketplace.
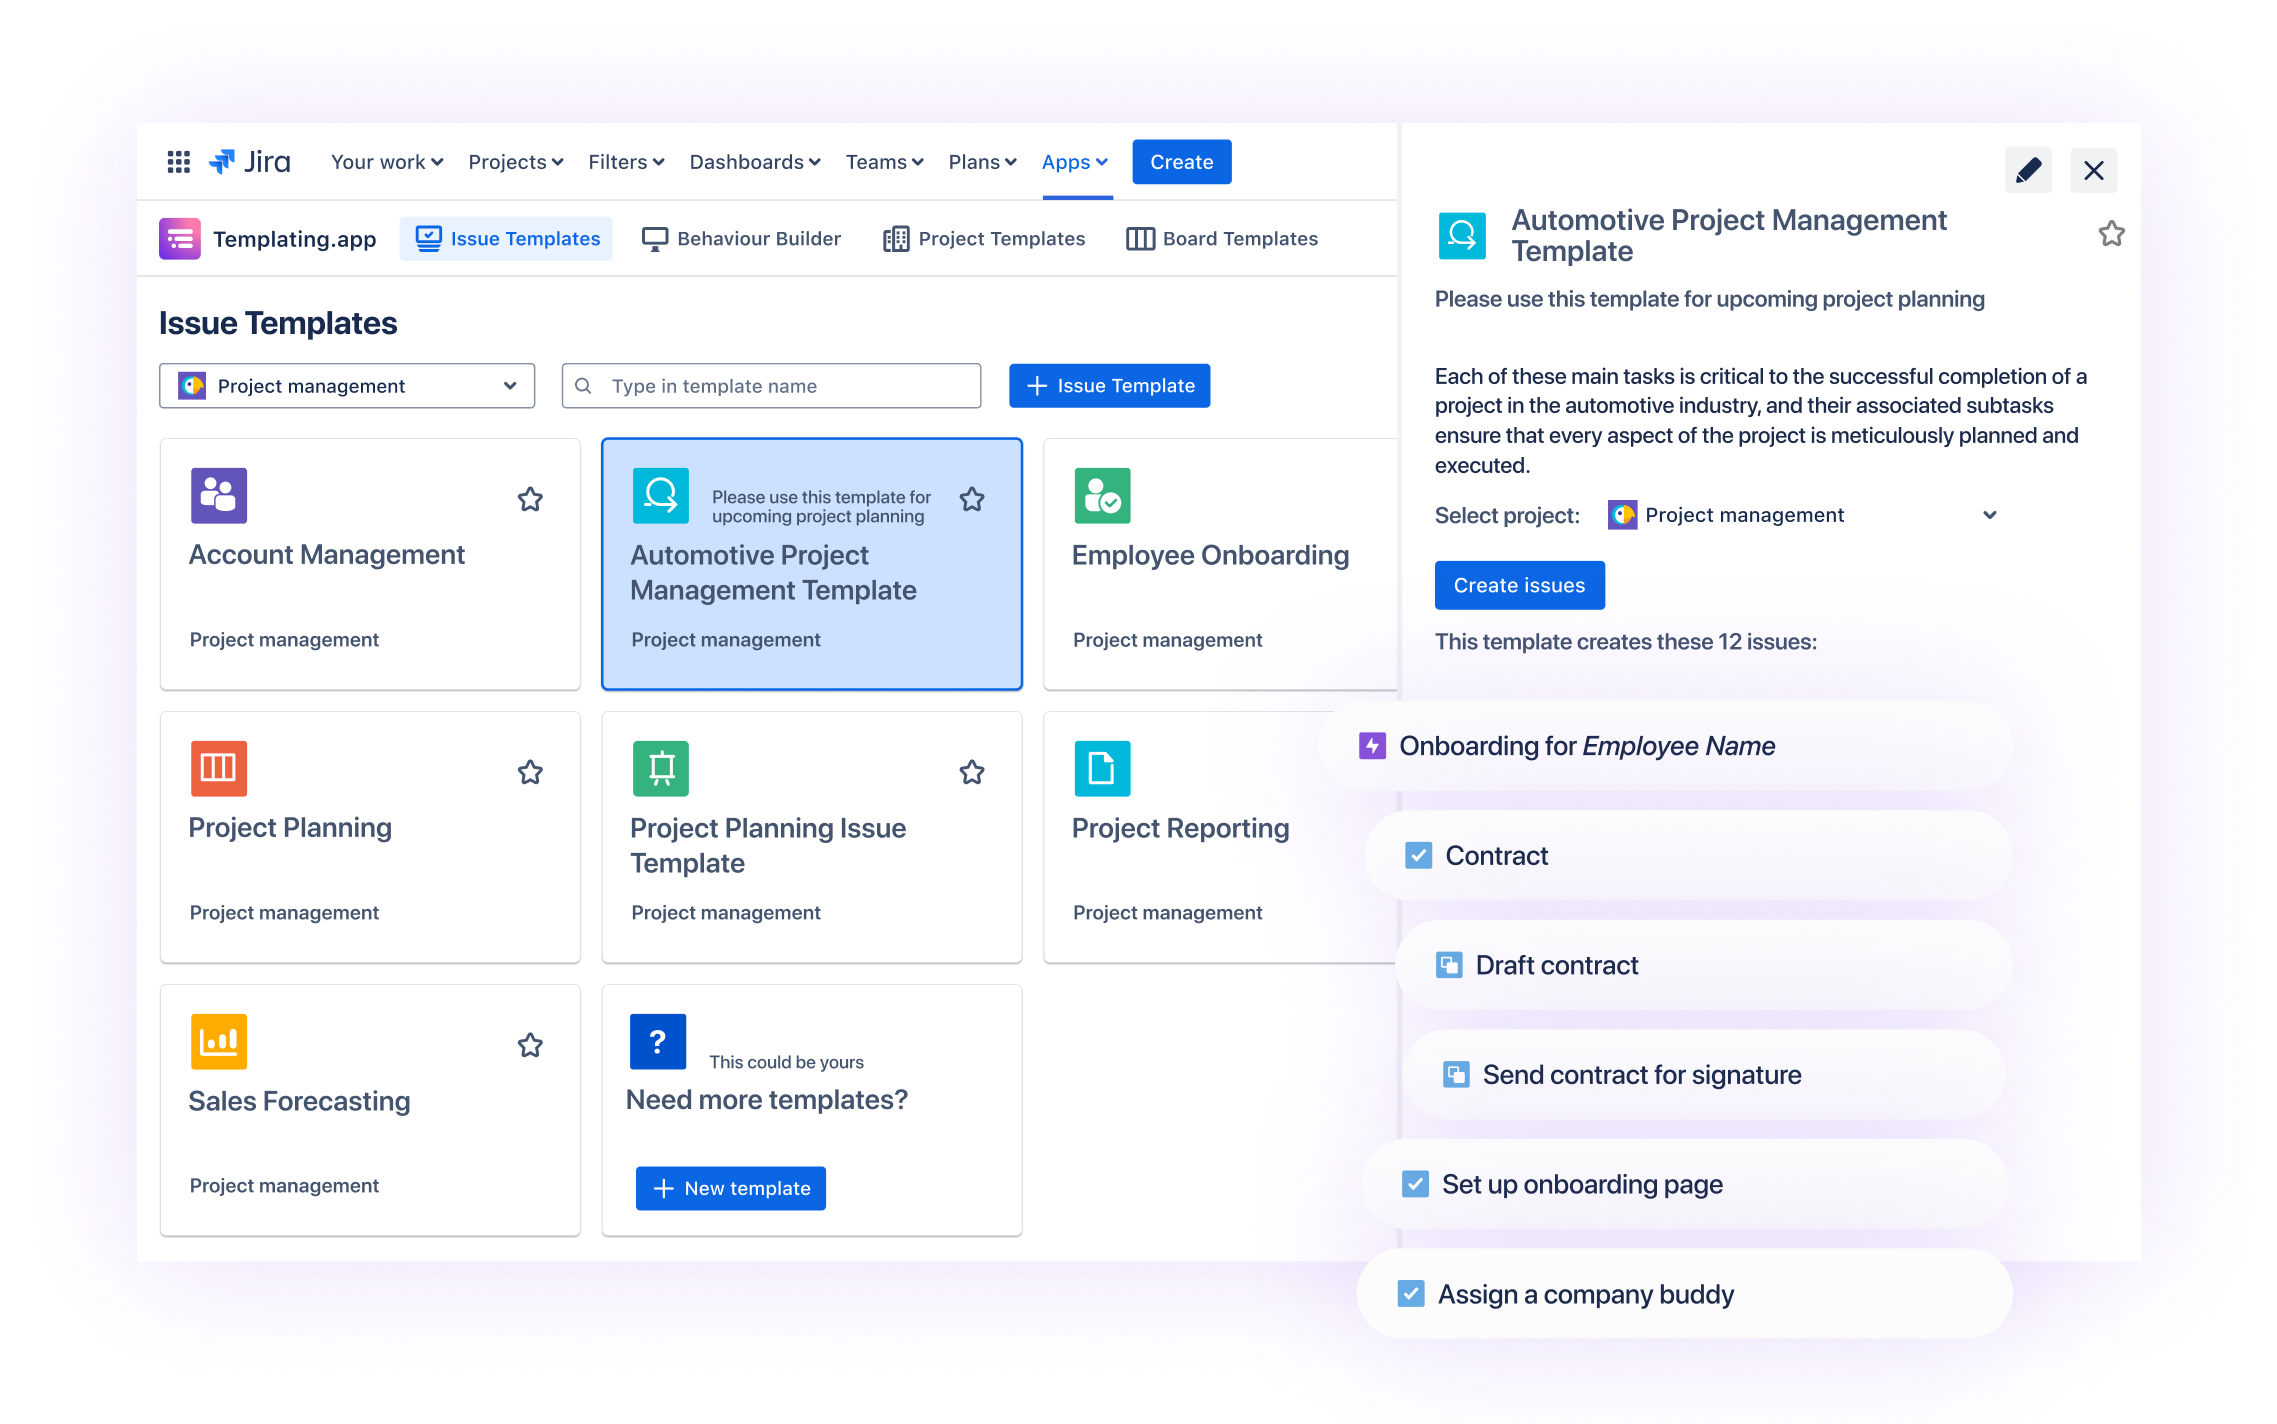
Templating.app extends your Jira Cloud Site with your very own Issue Template Gallery that shows users the templates they can use.
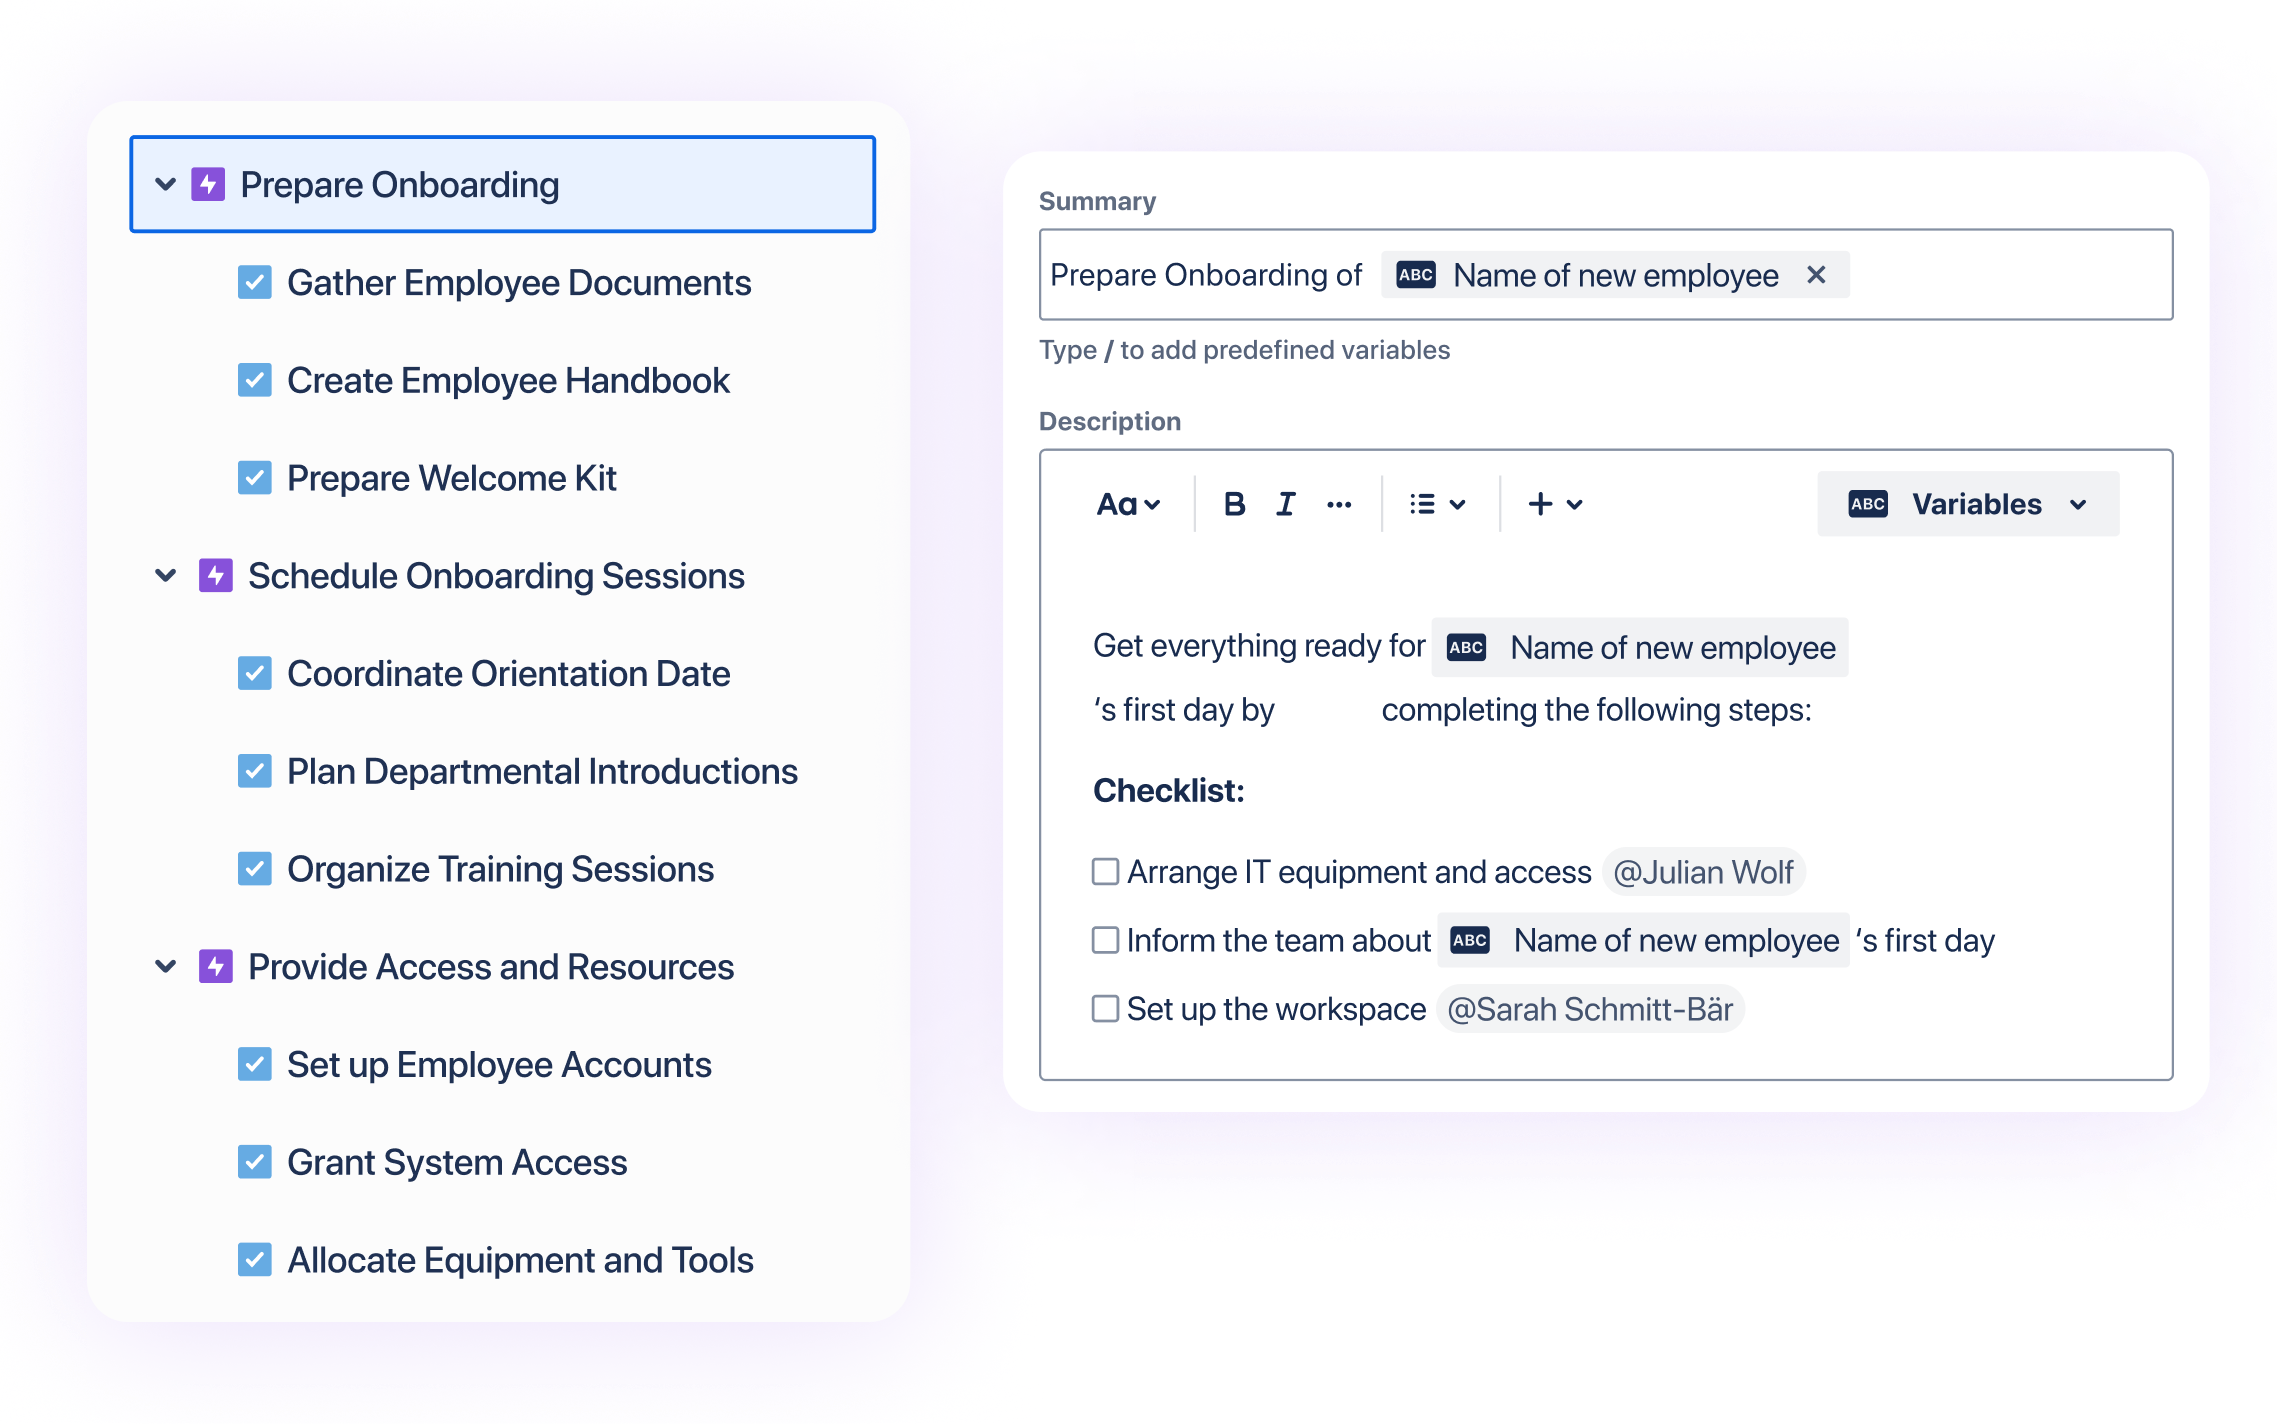
Forget about copy and cloning from existing issues. With our Issue Template Editor, you can now create your own template in minutes.
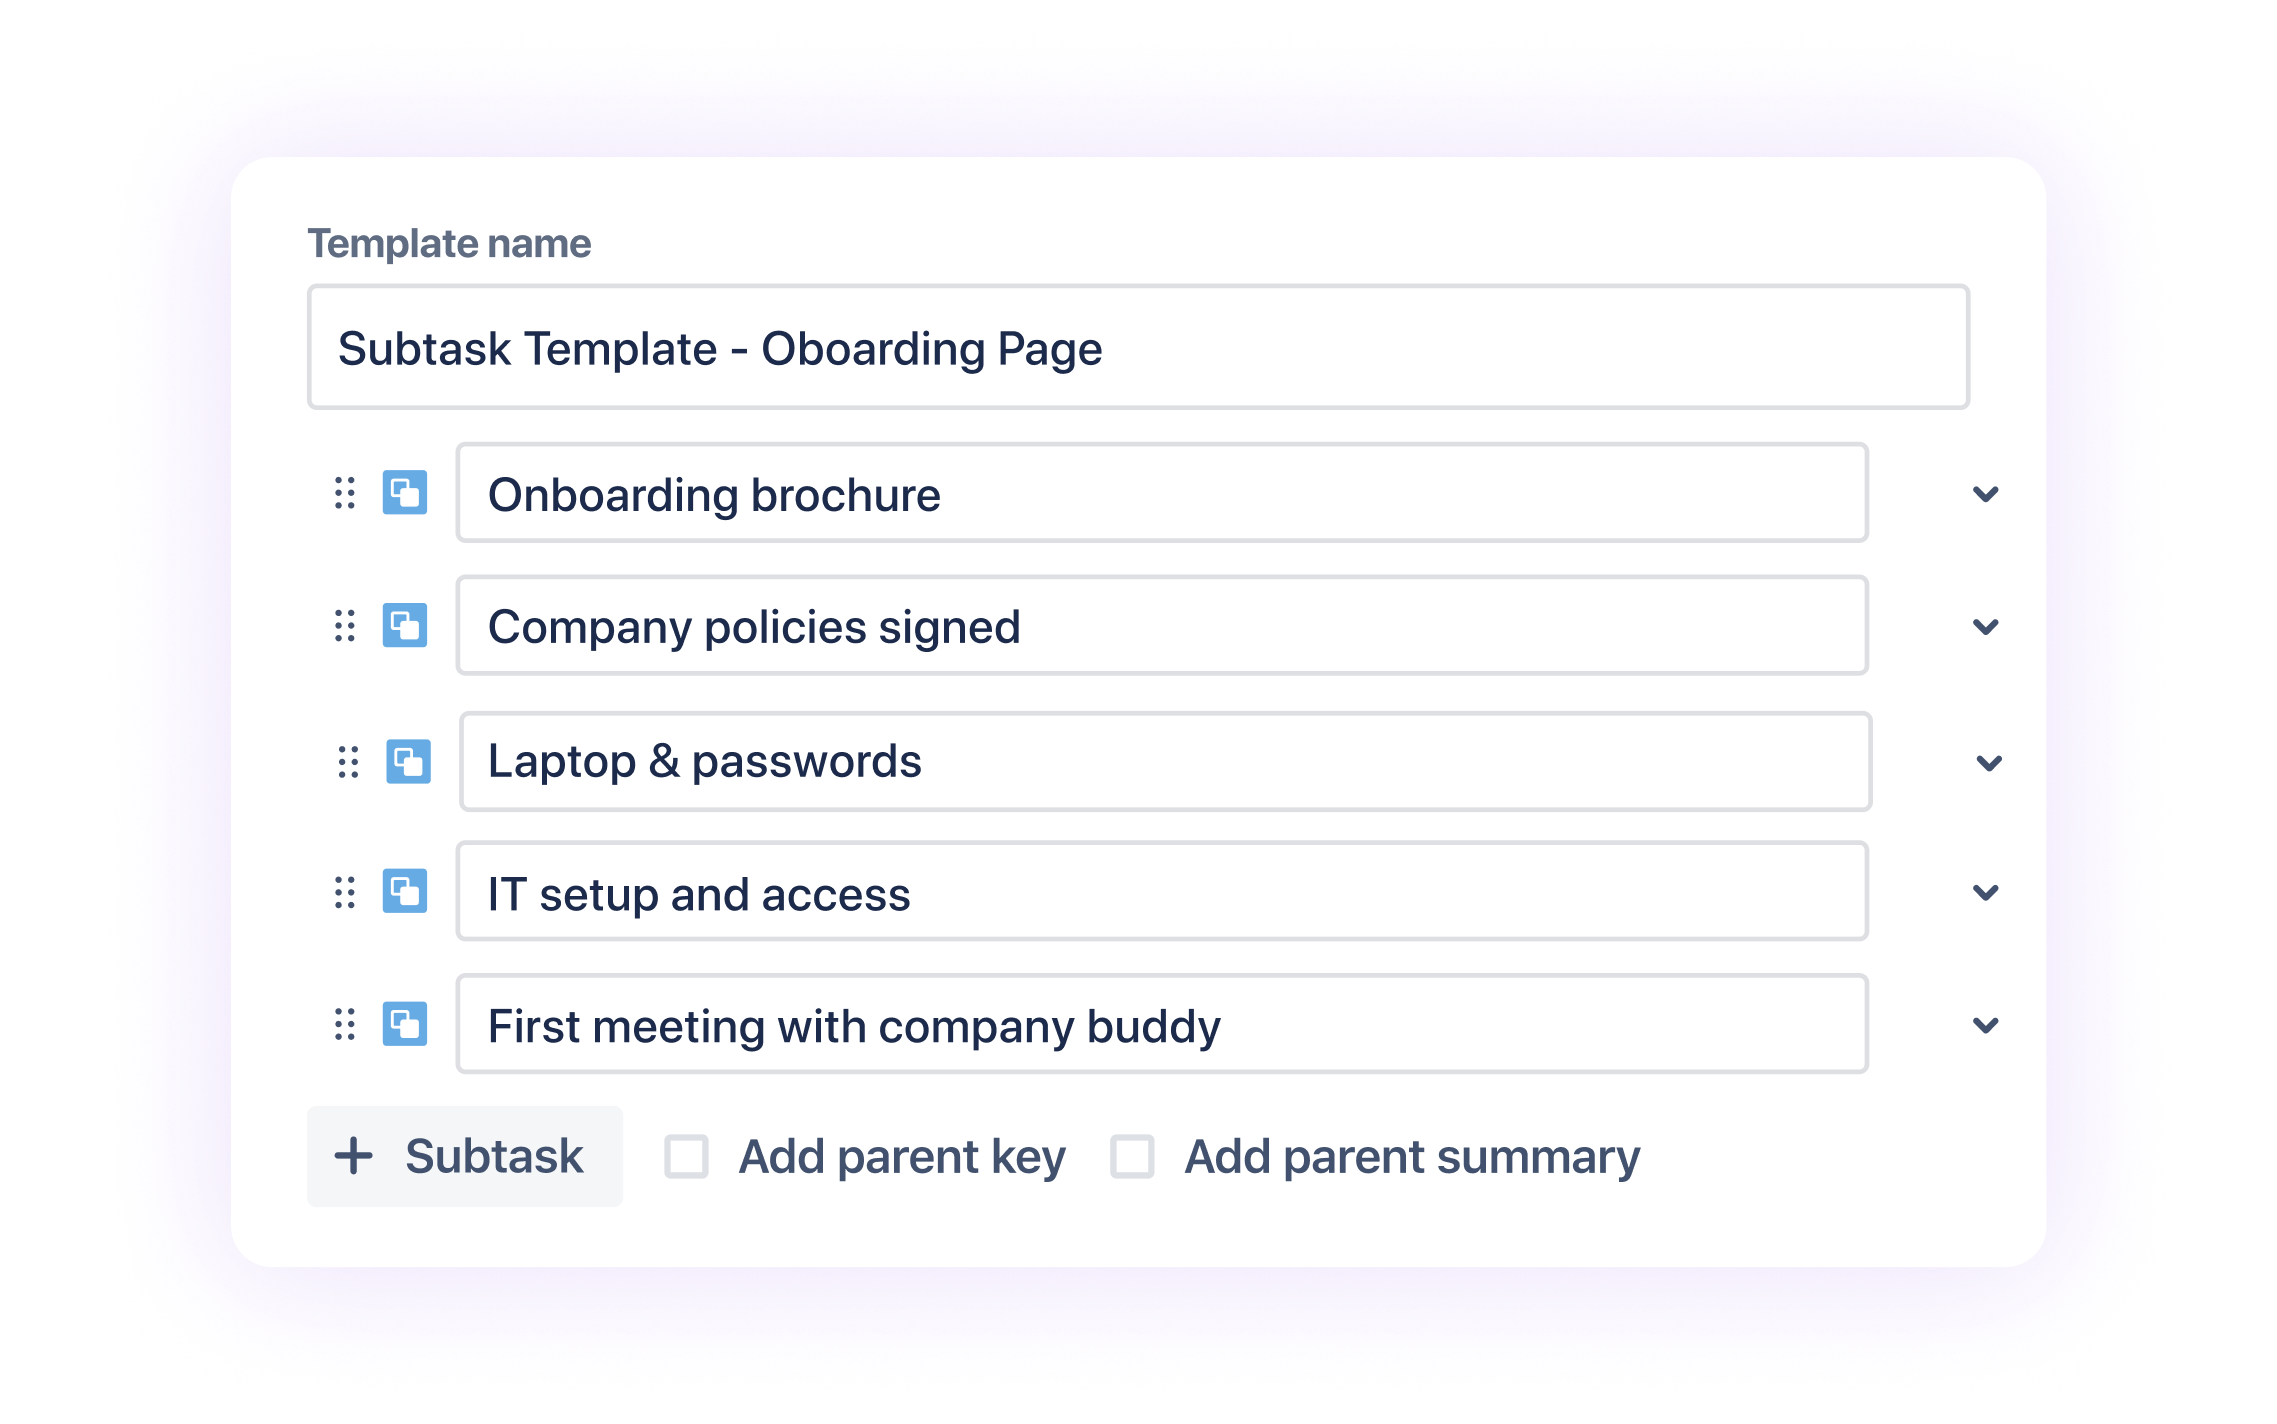
When working on a single issue, you often need to create the same subtasks. With Subtask Templates, you can that can add a set of tasks directly from the issue.